Is This Broken? Or Is It Just My Feelings?

I recently had the opportunity to ask some uncomfortable questions about one of the strategies I run. These situations never feel great - but they’re often the most valuable, because they force us to actually learn something.
So here’s a sanity-check framework I use, especially in those moments when a strategy starts generating more heat than expected wanted.
First things first: what is the strategy?
As a somewhat devout follower of the team at Option Omega, many of my strategies - or variations of them - originate from their ideas, whether from YouTube or their Discord.
One that caught my attention was their Reverse Iron Condor (RIC) after it was “fixed” by adding an additional VIX entry filter (The initial strategy was based only on an overnight VIX decline and suffered a sizable drawdown. Introducing an intraday VIX downside filter helped calm things down considerably). Below are links to the strategy exactly as it was shared in the video and the video itself:
https://optionomega.com/share/BXOERCfiXd99YvD9pwew
https://www.youtube.com/watch?v=_jhPs-Xi8Yg
Now, a few important observations right off the bat:
- The results assume scaled sizing of 2.5% per trade (My goal is to allocate 1%, since it comes with a lower maximum drawdown and integrates better with my existing strategies - though it will require a larger portfolio)
- The year-to-year P/L distribution isn’t smooth - 2023 stands out with a 44.48% return, while other years were solid but a bit less impressive - expectations should be adjusted accordingly (MAR may shrink over time)
- 2022 is a partial year (start of SPX dailies)
- 2025 is also incomplete at the time of sharing
- Average winner is slightly smaller than the average loser
- Max winner and max loser are almost identical
- The data sample isn’t huge - but given the leverage and observed edge, it may still be sufficient (we’ll try to quantify this as well)
- This is a ride-or-die strategy, which can feel scary - but also makes it harder to overfit, since it uses fewer filters and fewer degrees of freedom
What’s there to cry about?
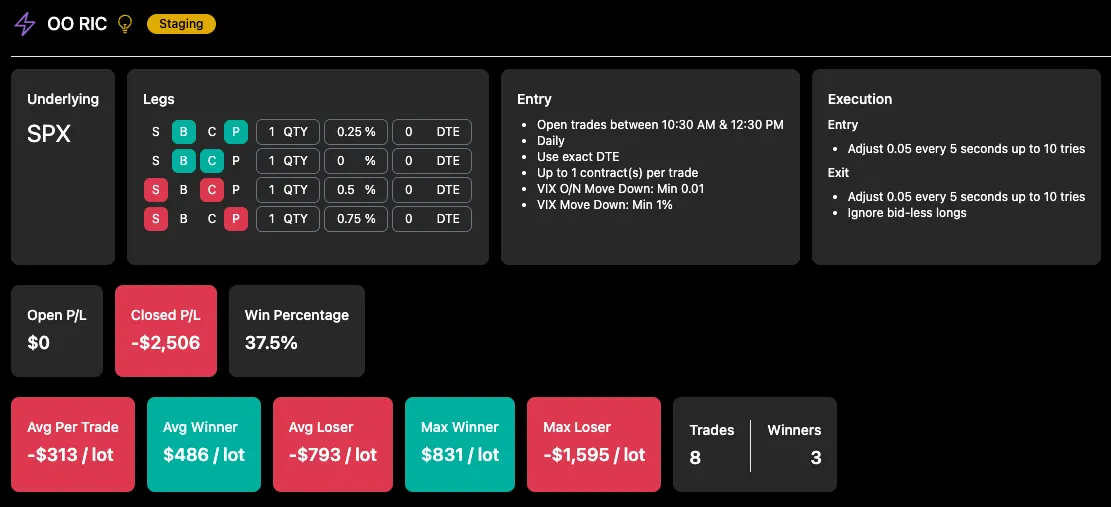
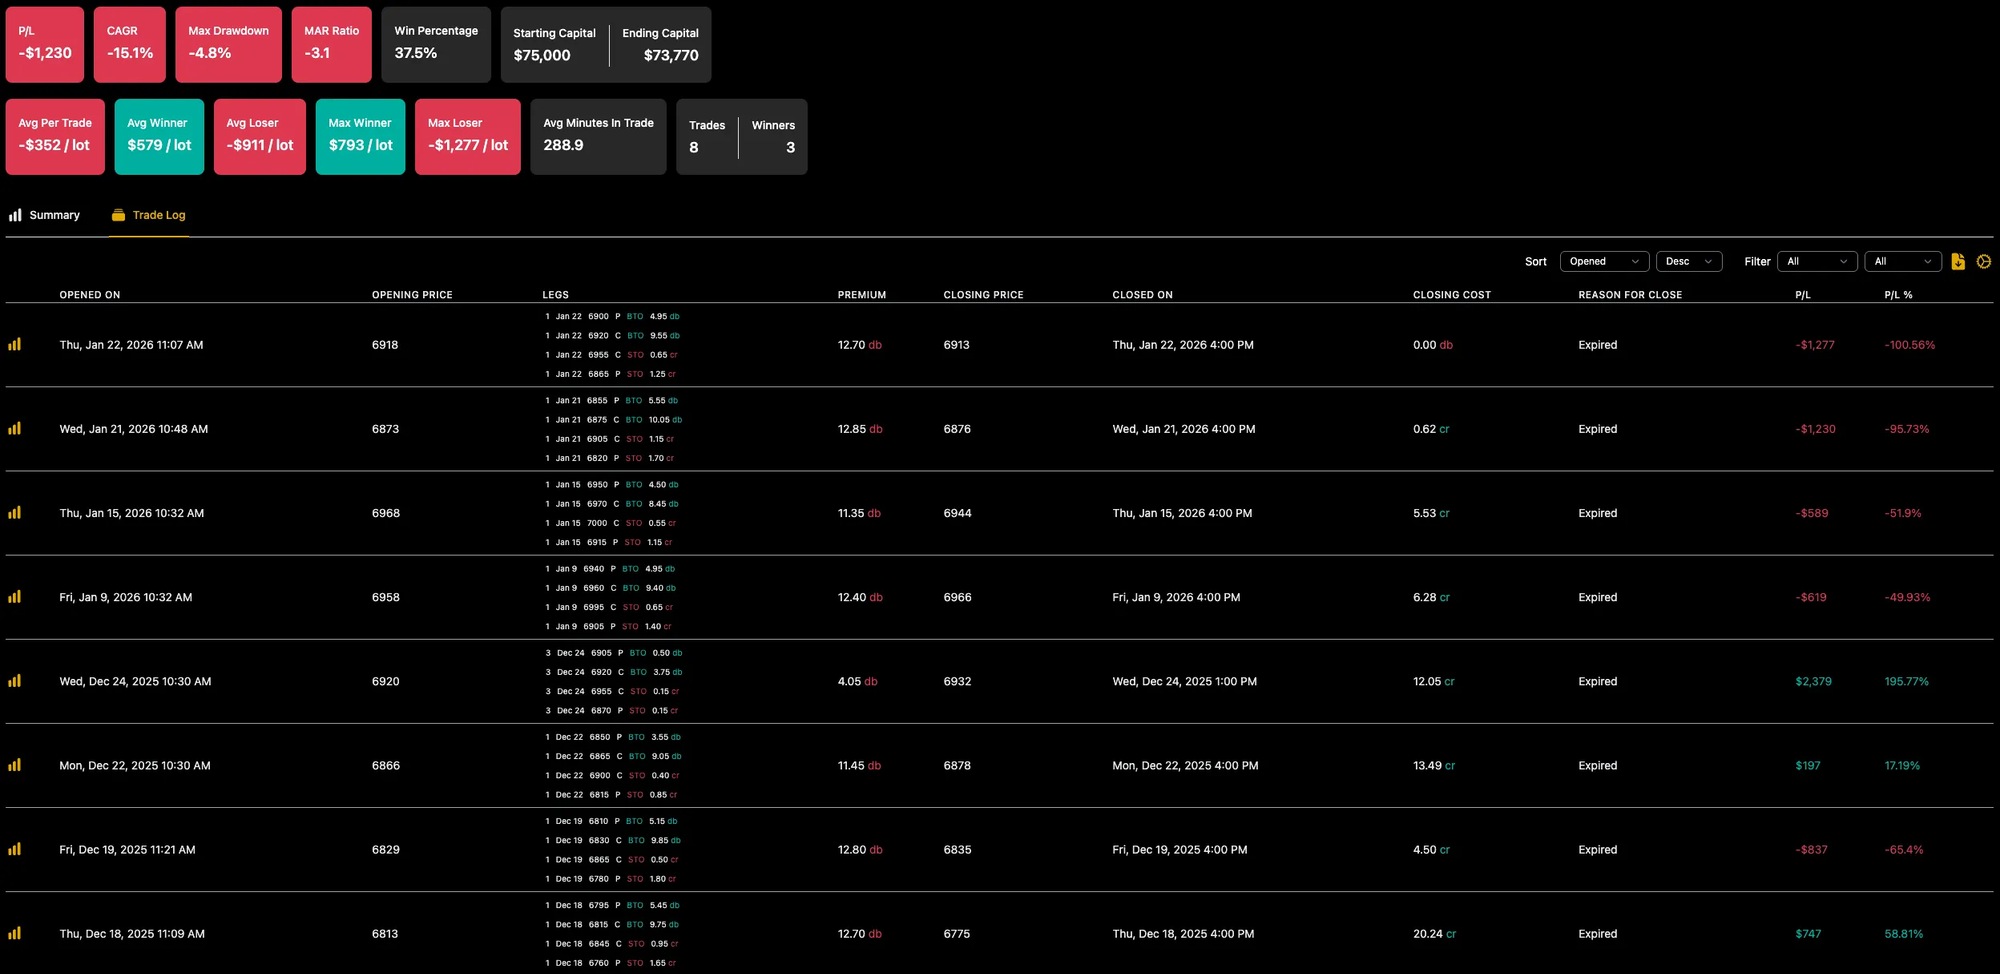
Eight live trades into my 1-lot test, I was down $2,500, which translates to roughly 3.3% of my portfolio.
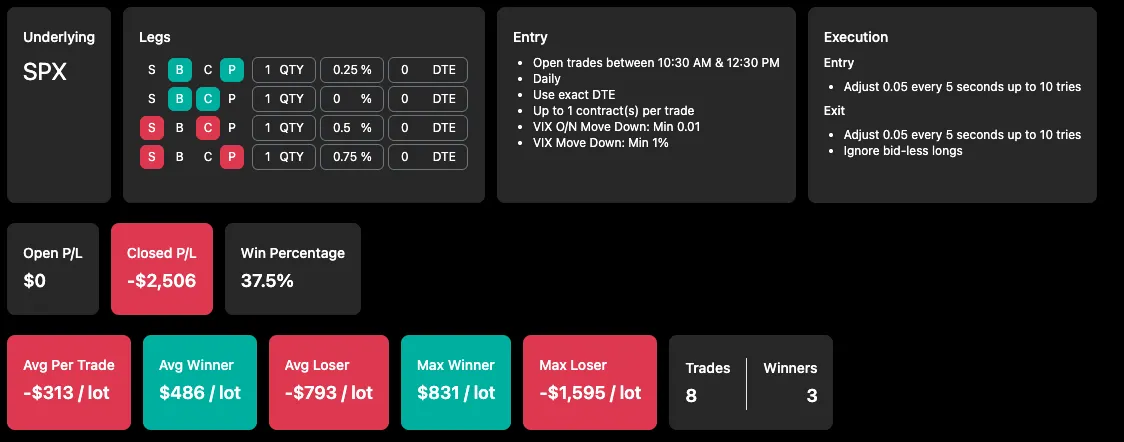
While this could simply be part of the game, it’s uncomfortable - especially when other strategies are performing well and this one is effectively wiping out their gains (which, to be fair, is also a sign that the strategies are largely uncorrelated and providing good diversification).
Before shutting it down emotionally, I had to stop and ask:
- What was I actually expecting?
- Is this drawdown normal for this strategy?
- If so - why would I stop it right before the edge has a chance to reveal itself?
Pure OOS and Sample Sizes
A simple and powerful trick I picked up from the guys on the Option Omega Discord - is to treat the strategy’s shared end date as the boundary between in-sample and out-of-sample data. Everything that comes after is pure out-of-sample data - data that didn’t exist when the strategy was published and therefore couldn’t have been “contaminated” by overfitting during development.
This is encouraging.
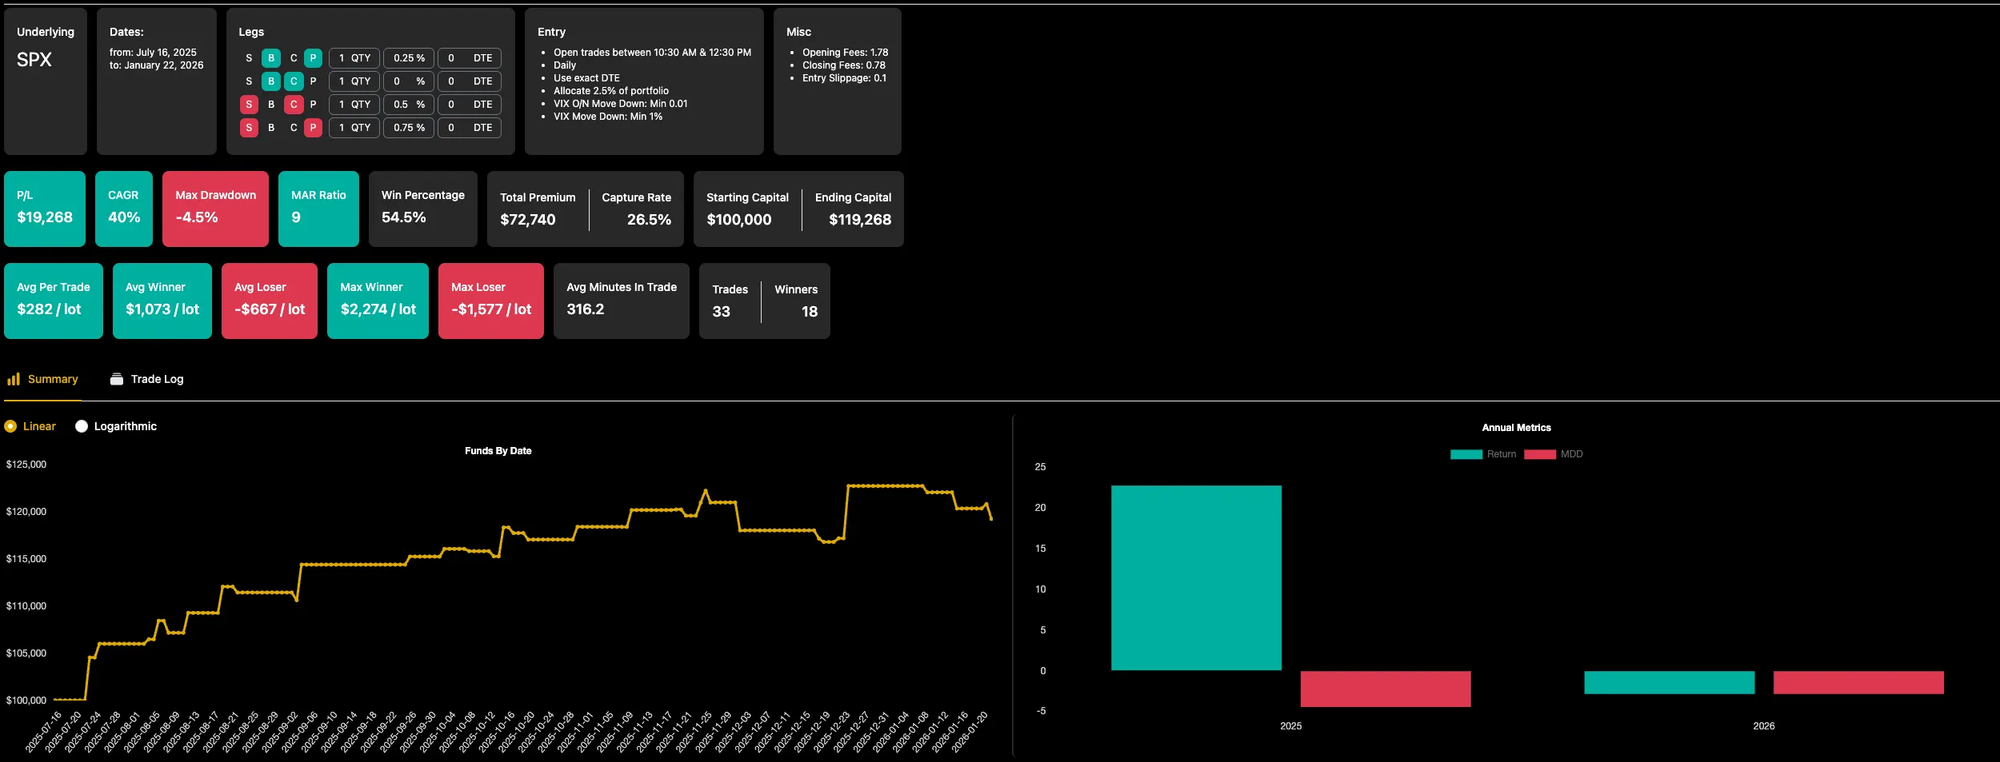
While 2026 is currently down (~2.85% YTD drawdown at 2.5% sizing), overall performance remains strong.
2025 finished with ~34% returns and ~6% max drawdown, which is impressive.
Over the five months following publication and across 33 trades, the strategy shows no signs of breaking down and continues to behave in line with its in-sample results.
It’s not a massive sample - but it’s enough to avoid immediate disqualification.
Since we’re already talking about sample size, here’s a nice way to put numbers around it. Let’s check whether we can trust this dataset by comparing the required sample size to the observed edge (mean expectancy).
For this part, I’ll use a Python CLI tool I built specifically for the task (let me know if you’ll be interested in such tools and I might share them). The script uses a Monte Carlo analysis, sampling directly from the existing per-contract P/L distribution - without assuming normality.
It generates thousands of randomized simulations by repeatedly drawing trades from the original sample, allowing trades to be re-ordered and selected multiple times. While Monte Carlo methods are useful for many purposes (risk assessment, drawdown exploration, etc.), the goal here is more specific: to estimate the statistical power of the observed edge, assess how confident we can be that the results are not purely random and how many trades are required to achieve a certain confidence level.
In simple terms, the test works like this:
“Out of 10,000 randomized simulations of the trade outcomes from your given sample, X% resulted in a positive average return. For Y% positive simulations you will need approximately Z trades”
That percentage becomes our confidence level, and from it we can infer how many trades are needed to reach a target power (for example, 95%).
This approach isn’t without limitations. The observed edge is derived entirely from the available data, which may itself be skewed - especially with small samples dominated by winners or losers. Still, it’s a useful tool because it helps us explore alternative paths that didn’t actually occur but could have.
For the first step, I ran the script on the in-sample portion, using the original backtest data as it was published (May 16, 2022 - July 16, 2025).
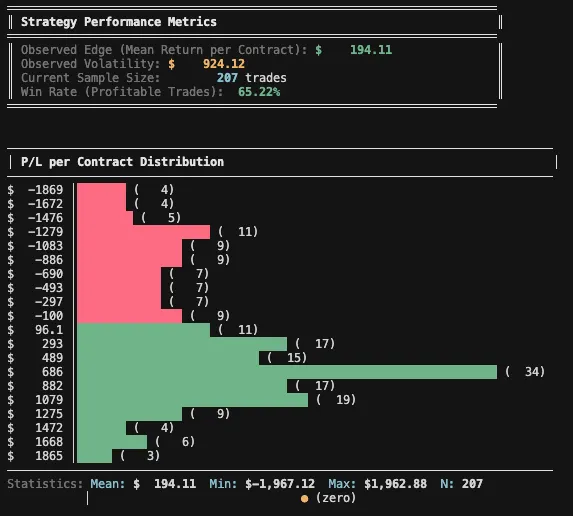
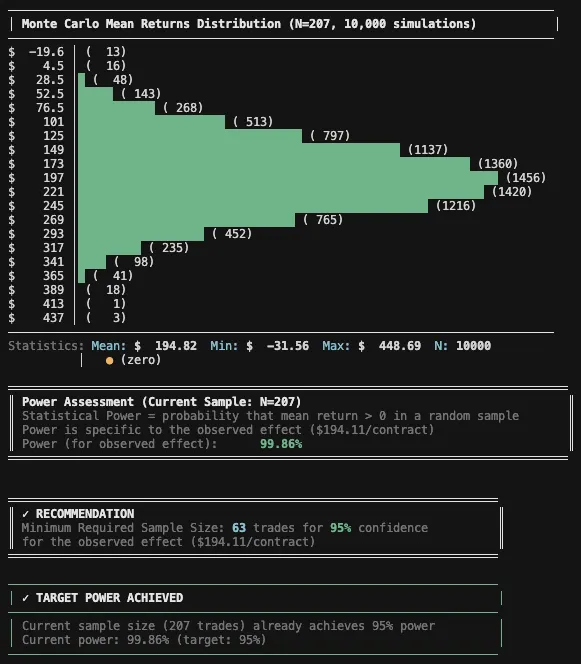
Given an observed effect of $194.11 per trade and a desired confidence level of 95%, the analysis suggests we would need roughly 100 trades. With 207 trades in the sample, we’re comfortably on the safer side.
For the OOS part (July 16, 2025 - January 22, 2026):
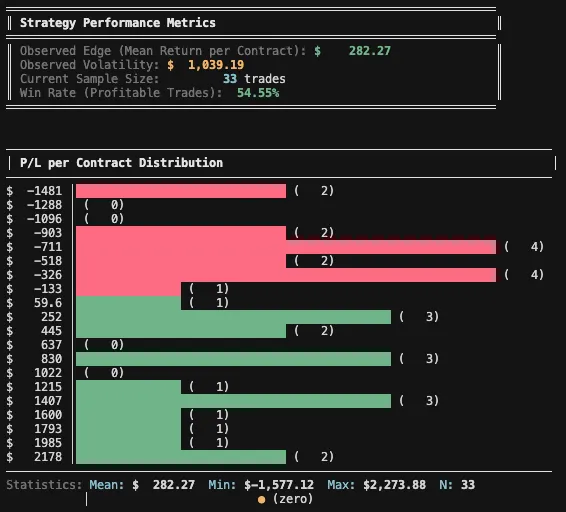
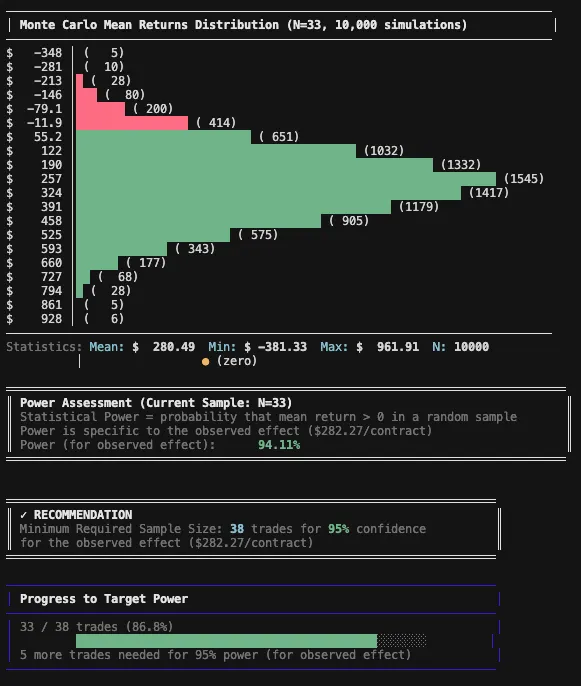
Using this method, the current out-of-sample confidence level since the strategy’s publication is 94.11% - meaning that 94.11% of the 10,000 Monte Carlo simulations produced a positive mean return when randomizing the existing OOS trades. That’s a solid result.
That said, it’s important to keep expectations grounded. The longer-term observed effect of this strategy, based on the earlier sample, is $194.11 per trade (required 63 trades for 95% confidence), which likely skews this OOS result somewhat in our favor. As the effect size naturally degrades over time, we should expect performance to normalize - and, correspondingly, the number of trades required to maintain the same confidence level will increase, since smaller effects need more data to reliably emerge in noisy, random environments.
Overfitting to tail events
Another useful test is to evaluate the impact of "tail" events on overall results. The idea is to understand how much we rely on these extreme outcomes as a profit driver.
The test is simple: take the mean absolute P/L of the top 1% "big" trades and divide it by the mean absolute P/L. The result tells you how much larger these trades are on average-and ideally, you want this multiple to be low.
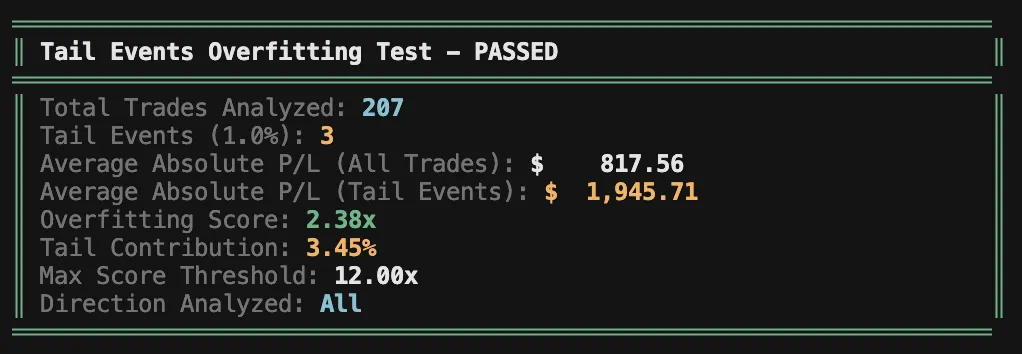
In this case, the top 1% outcomes are only 2.38x the average outcome - which is very low.
You can also "eliminate" these trades from the sample and reassess your key performance metrics without them. While this result is unrealistic (we do expect tail events going forward), we don't want to rely on them. We want a strong, stable baseline we can trust in which positive outcomes dominate the negative overall and create an overall positive expectancy.
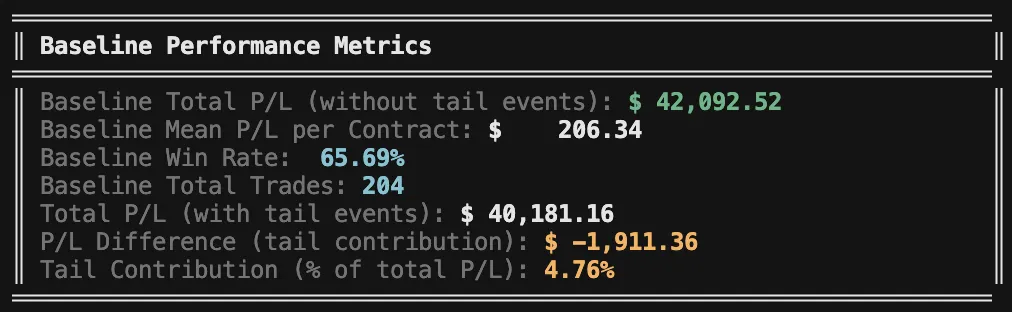
This shows the strategy is quite robust - even excluding the 1% tail events still leaves us with most of the profits and strong overall performance.
Note that this test is mostly relevant to convex strategies (usually debit-based), since selling premium has capped upside and can't generate high yield on risk. It's also not relevant to any system-options or otherwise-that's specifically designed to capture tail events.
A simple truth: max loss per trade and max drawdown
A few grounding facts help put this into perspective:
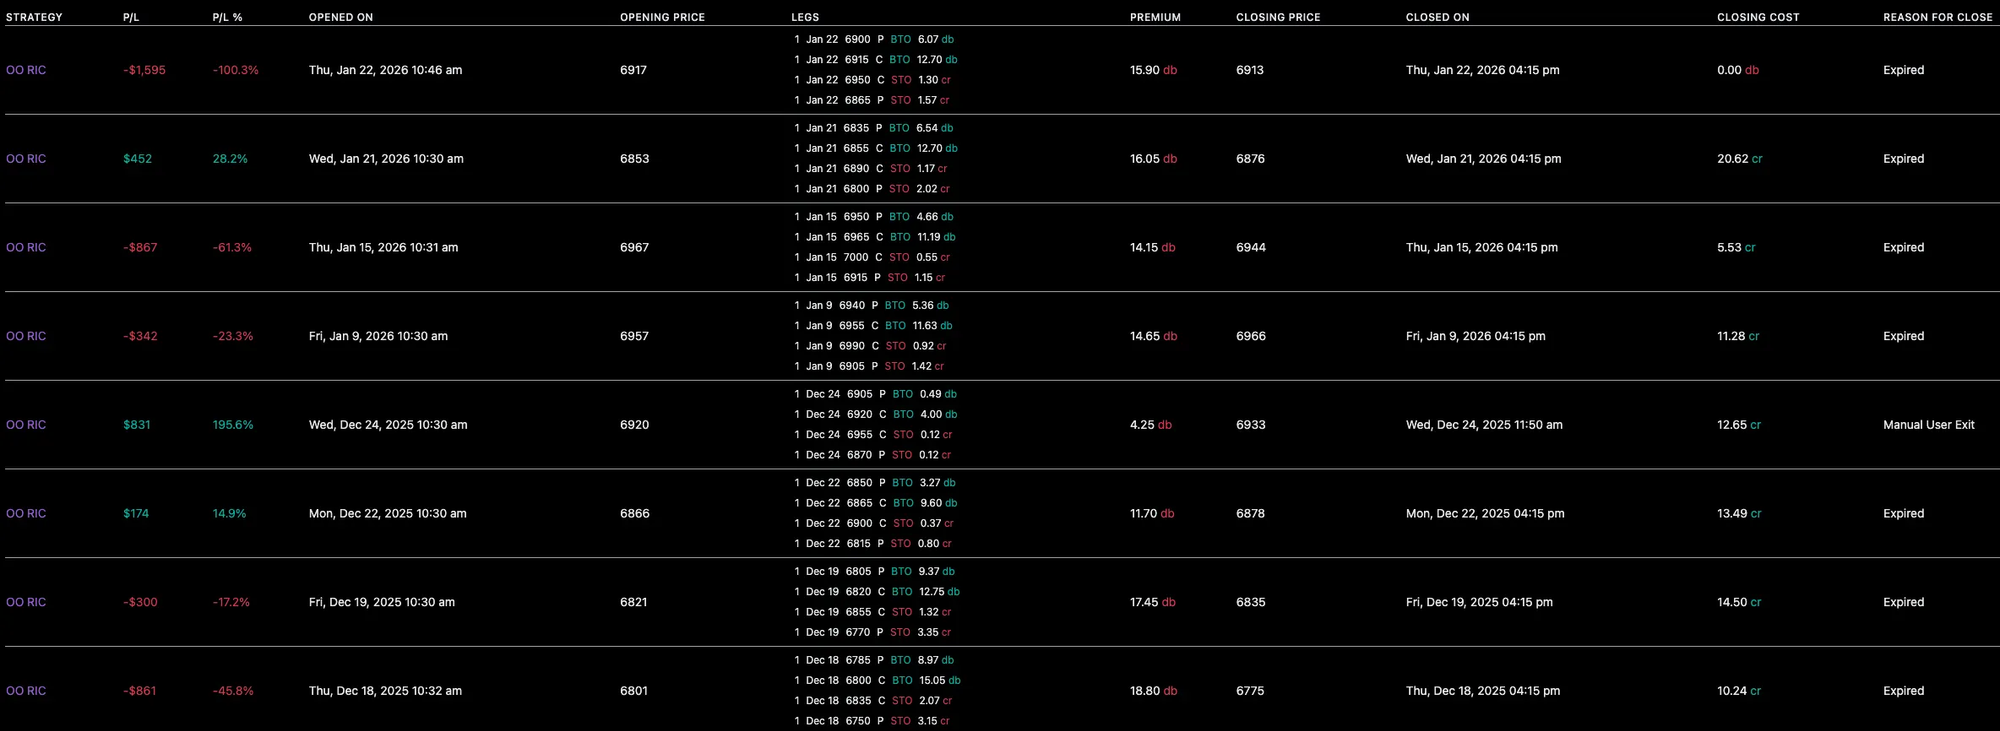
- The worst real-life loss per lot so far came in at about $1,595, while the historical worst loss was closer to $1,900 - meaning this outcome was well within what I should have expected.
- The historical max drawdown was around 6.4%, while my realized drawdown sits near 3.2%, or roughly half of the historical pain.
Yes, starting a strategy inside a drawdown feels worse psychologically - but that’s an emotional trap. We never know where we enter a strategy’s equity curve.
This is a reminder of why proper sizing matters.
At 2.5% allocation per trade, this strategy sits right at the edge of my comfort zone. I’d prefer to trade it smaller - but since I’m already at 1-lot, the only real solution is a larger portfolio.
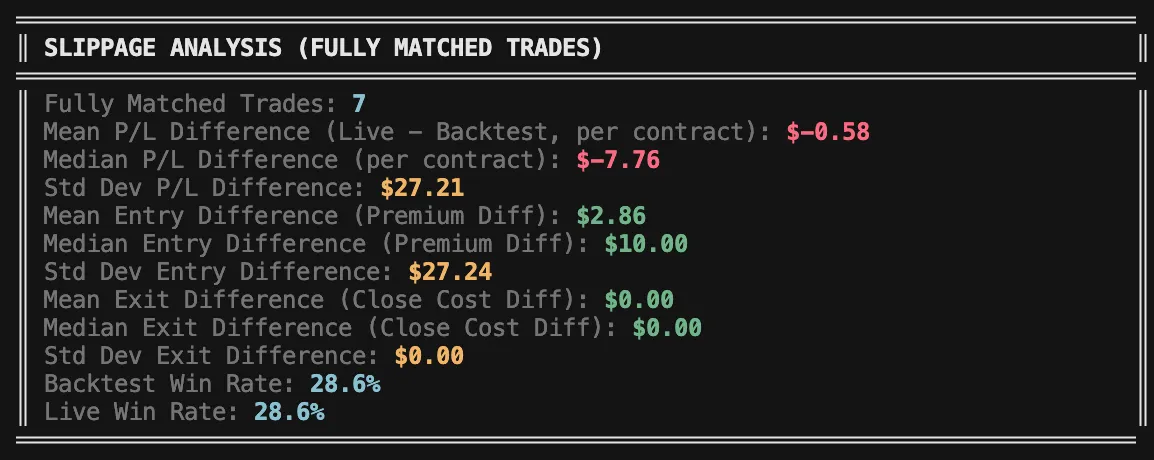
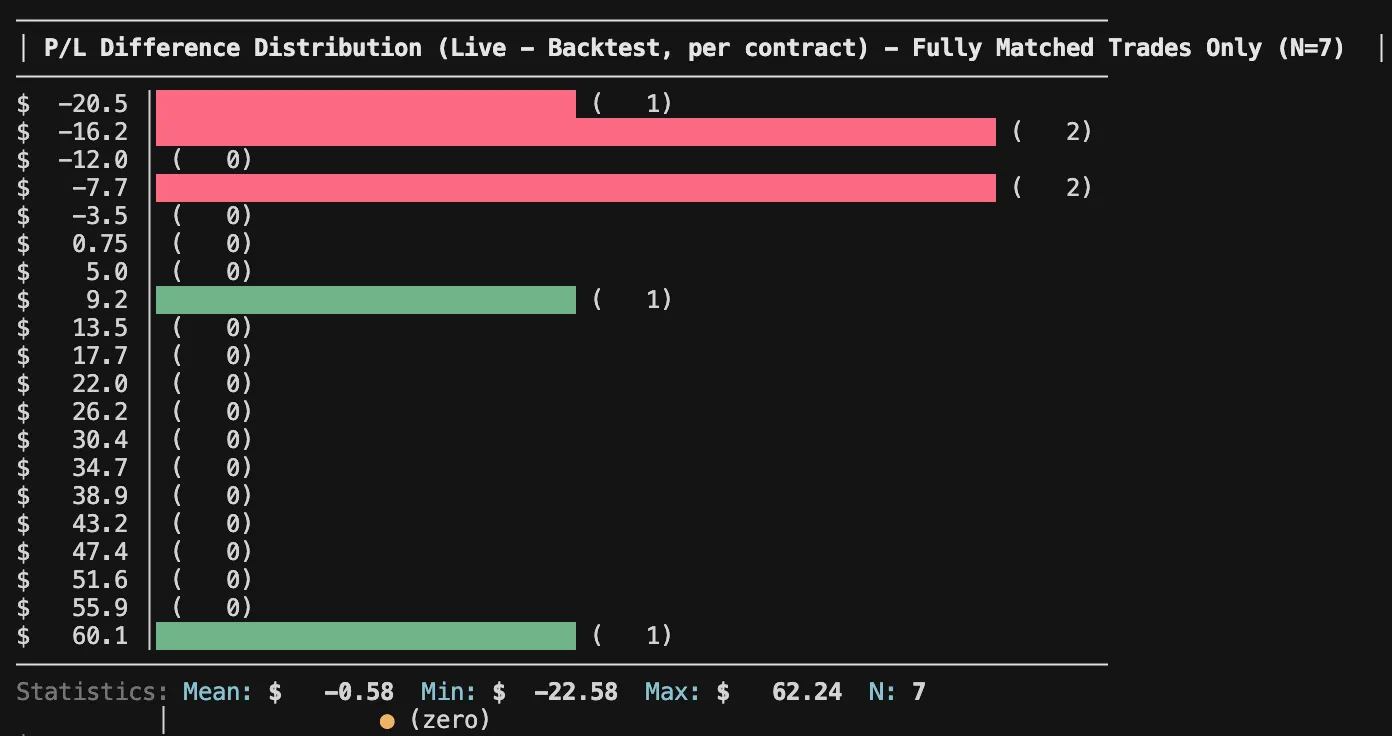
Real Life Execution
To trust that the backtest reflects real-life behavior, we first need to confirm that live execution aligns with it over the period I was trading live. That alignment is what makes any long-term profitability assumption more credible.
I looked at:
- Entry time and structure
- Exit timing and reason
- Missed or extra trades
- Price deviations for exact matches (entry and exit)
- Overall average P/L deviations
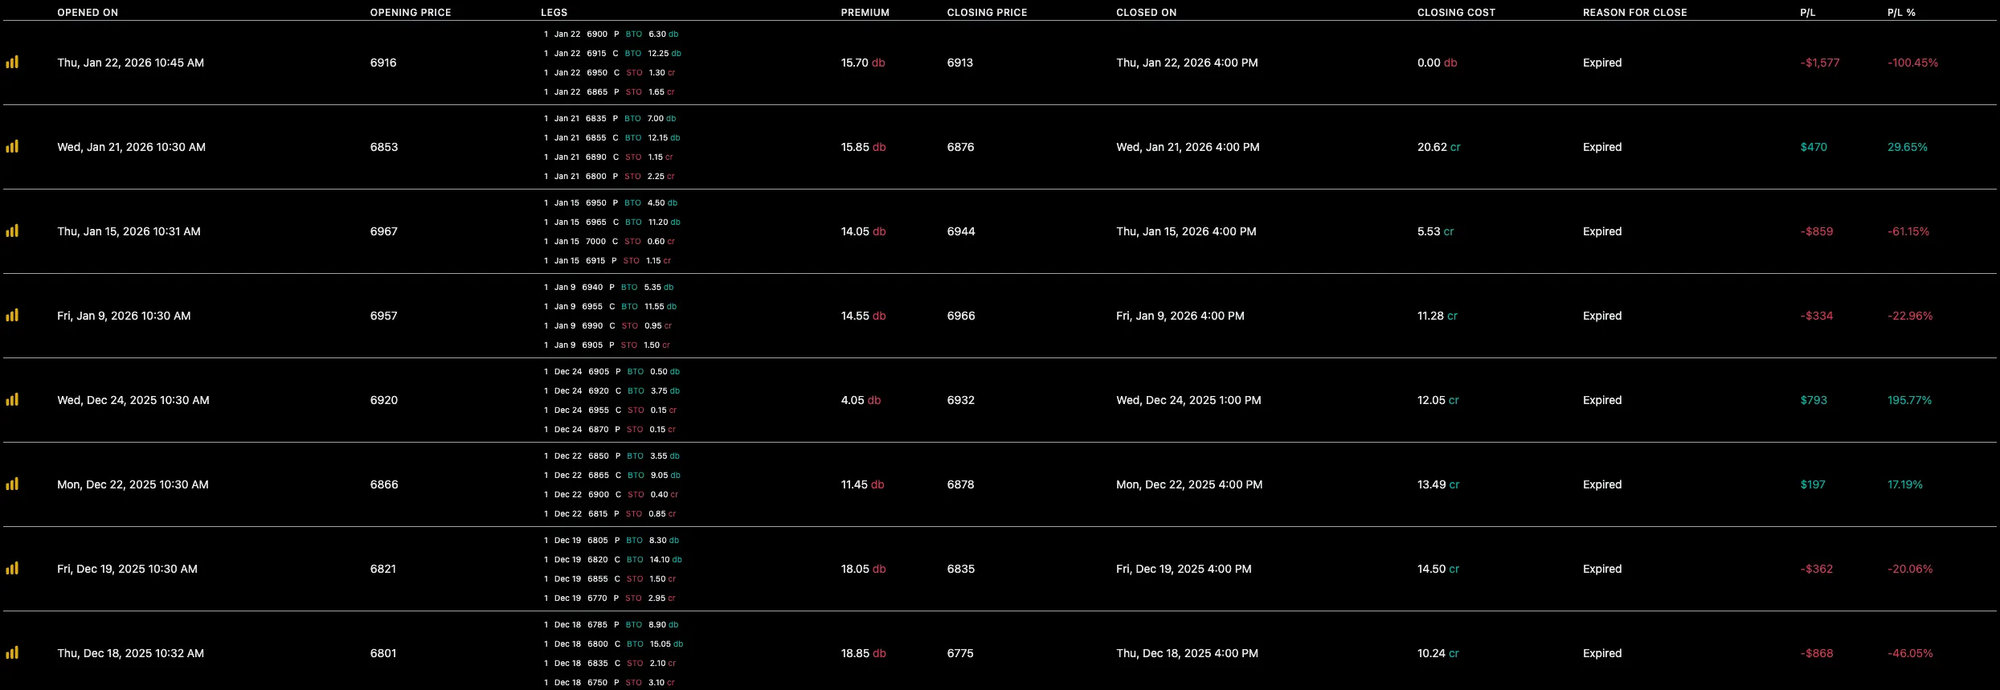
Backtested results for the same period (1-lot):
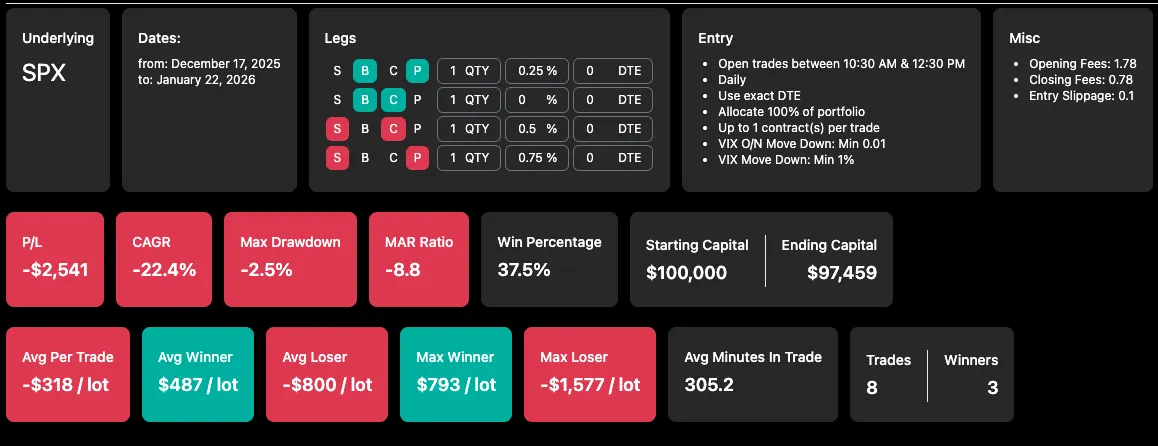
When under sizing hurts (!)
Before running the 1-lot backtest, I accidentally left the original 2.5% sizing on a $100K portfolio.
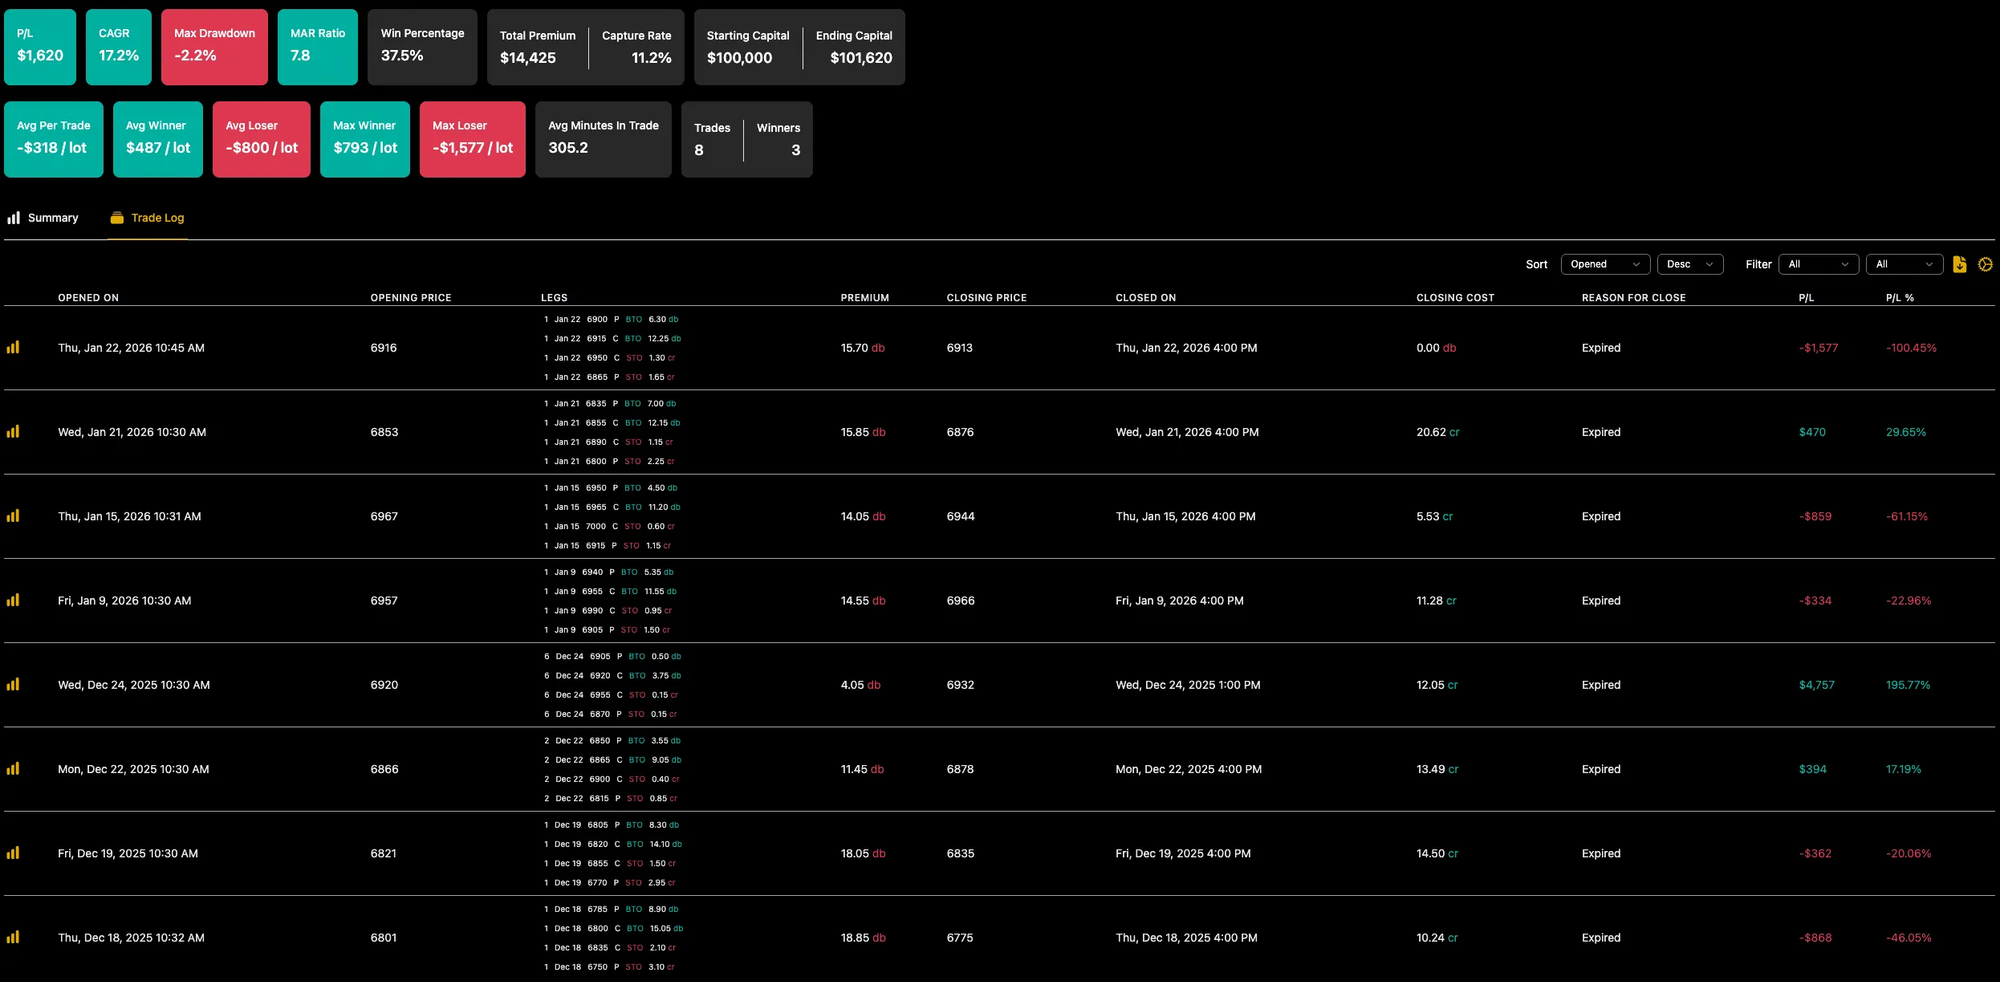
That made the backtest look green - and immediately raised a red flag. How could I have lost while the backtest won for the same period, just because I changed from 1-lot sizing to dynamic allocation?
The answer was that two trades were very cheap, allowing the system to trade 2x and 6x size. One of them happened to be a large winner.
When I re-ran the test using a portfolio size closer to mine, the loss shrank to $122 - mostly because the big winner was scaled up.
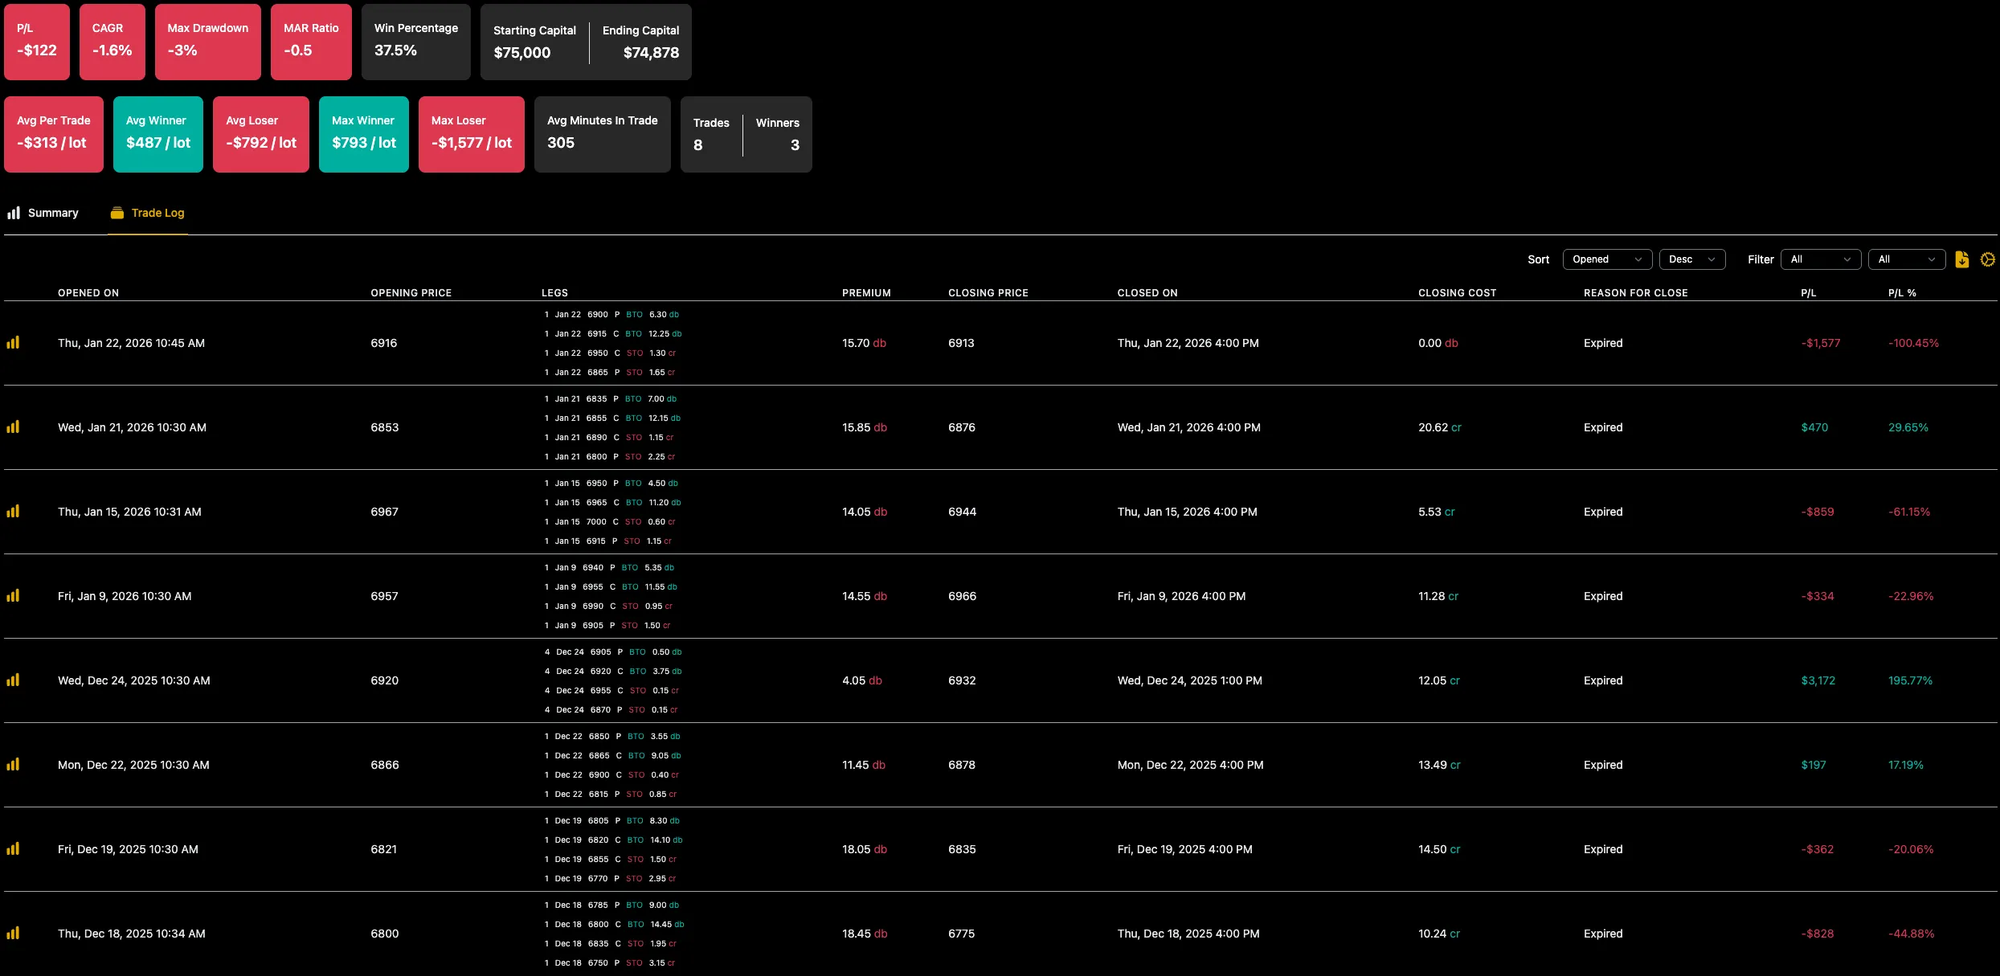
And when I ran it with my intended 1% allocation, the result was far less painful.
The key insight
For debit, convex strategies like this one, 1-lot live testing can be misleading.
When prices are cheaper than usual, proper exposure requires more contracts. Fixed 1-lot sizing removes that flexibility and can actually increase short-term risk, because not all trades are given an equal chance to impact results.
In this case, 1-lot sizing made the strategy more dangerous, not less.
This doesn’t mean you shouldn’t run a low-allocation test (you can still think of it as 1-lot testing). Just make sure you understand the actual distribution of 1-lot sizes so you’re using a proper percentage-based allocation. In practice, that means choosing a % allocation that typically results in a 1-lot trade, while occasionally allowing slightly larger sizing to compensate when contracts are unusually cheap.
This was my $1,276 lesson - take it for free.
Bonus: this is where diversification helps
This entire exercise was about expectations and psychology under pressure. But it’s also a reminder of why uncorrelated strategies matter.
During this drawdown, some of my other strategies were performing well, helping stabilize the overall portfolio.
That said - diversification isn’t magic. There will be days when everything loses together.
That’s why I prefer portfolio backtests with ~5% max drawdown, so I have room for reality to be worse than history.
Final takeaways
- Every strategy has drawdowns-the real question is whether you sized it properly, understood it honestly, and gave it enough room to prove itself.
- Panic kills good systems. Preparation and patience keep them alive.
- "1-lot sizing" is just a name for live testing-but don't under-allocate. Give all your trades an equal chance to impact results, even if that means trading 3-lot on a specific trade. What truly matters is consistent sizing relative to your portfolio.
- If you can't stomach the margin requirements for 1-lot sizing of a certain strategy - you probably shouldn't trade it live yet.
Trade safe - and may G-d guide your expectancy.